Submitted by: Paul Wiseman (paul.wiseman@mcgill.ca)
General area of research: Biophysics
McGill courses: Phys 319, Phys 519
Why you chose to feature this researcher:
More info:
Highlighting research:
Describe in detail the research from this individual that you would like to highlight:
One of the top researchers in single molecule biophysics revealing detailed aspects of gene regulation through use of advanced super-resolution imaging and fluorescence labeling techniques.
How does this research relate to a undergraduate curricular topic, and teachable concepts in physics?
What is the significance of this research? This can mean within the particular field, as well as broader societal relevance.
Advancing applications of super-resolution imaging and advanced fluorescent labeling to unravel the complexities of gene regulation
Do you wish to upload figures and/or images relevant to understanding the research?
URL: https://physics.mit.edu/faculty/ibrahim-cisse/
Slides PDF
Speaker Notes
Introduction slide / General speaker notes:
Synopsis of work:
Ibrahim Cissé is a biophysicist who uses single molecule and super-resolution microscopy and fluorescent labeling techniques to visualize gene expression and dynamic processes in living cells. Cissé led his team in developing tcPALM to study the dynamics of RNA polymerase II (Pol II) in living cells and construct super-resolution images of RNA transcription at the gene locus. They made the discovery that Pol II form subdiffractive clusters that were not previously imaged in living cells using conventional fluorescence microscopy techniques. They found that these clusters assemble and disassemble in a fraction of the time it takes Pol II to transcribe DNA into RNA. They then discovered a new mechanism for gene regulation, evidenced by the linear correlation between the lifetimes of Pol II clusters at a gene locus and the number of RNA transcripts produced at that gene locus.
Researcher's background:
Cissé was born and raised in Niger, Africa, and moved to the United States where he studied Physics and received his BSc in 2004 from North Carolina Central University. He received his PhD in Physics from the University of Illinois at Urbana-Champaign in 2009. His graduate work focused on the intersection of physics and biology. In 2010-2012, he pursued his postdoctoral studies at Ecole Normale Supérieure in Paris where he continued to work in the physics and biology departments as a Pierre Gilles de Gennes fellow and a European Molecular Biology Organization fellow, respectively. After returning to the United States in 2013, he worked as a research specialist at the Howard Hughes Medical Institute’s Janelia Research Campus. He became an Assistant Professor at the MIT Department of Physics in 2014 where he started Cissé Laboratory, then became an Associate Professor with tenure in 2020. His awards include, but are not limited to, the Young Fluorescence Investigator Award from the Biophysical Society, the Pew Biomedical Scholars, the National Institutes of Health Director’s New Innovator Award, the Vilcek Prize for Creative Promise in Biomedical Science. and was nominated and chosen by students at MIT for the Institute’s Everett Moore Baker Award for Excellence in Undergraduate Teaching.
Societal relevance:
Cissé’s work in developing super-resolution imaging techniques has furthered the understanding of the molecular machines involved in gene expression in living cells. Single-molecule fluorescence microscopy had been limited by the diffraction of light until around 2006 when techniques such as PALM/STORM (photo-activated localization microscopy/stochastic emissions deletion) were developed to reconstruct images at the sub-wavelength scale. Even then, the specimens that were possible to image were restricted to chemically frozen or dead biological samples that remained static over the course of an observation. Cissé and his team’s tcPALM (time-correlated photo-activation localization microscopy) approach analyzes temporal information and has made new discoveries of the dynamics of living cells. These new experimental approaches will uncover more information about the mechanisms behind gene regulation.
General citations and resources:
https://www.ie-freiburg.mpg.de/5628207/2021_09_20_I_Cisse_New_MPI-IE_director
Slide 1: Central dogma of molecular biology
Science details:
The central dogma of molecular biology is the process by which genetic information flows within the cell of a living organism. Genetic information is carried by 3 classes of biopolymers: DNA (deoxyribonucleic acid), RNA (ribonucleic acid), and protein. The dogma is often stated as a 2-step process wherein DNA makes RNA, then RNA makes protein but this is an incomplete description. There are several classes of information transfer suggested by the dogma. The three “general transfers” describe the normal flow of genetic information that takes place in cells: DNA replication (DNA is copied to DNA), transcription (DNA is copied to messenger RNA, or mRNA), and translation (proteins are synthesized using a template encoded in mRNA). Transcription and translation are the two key stages of gene expression: the process of producing a function product (protein or non-coding RNA) from the genetic information from a gene. RNA polymerase II (Pol II) is an enzyme which reads the information in DNA and converts it to RNA during transcription.
Citations and resources:
https://en.wikipedia.org/wiki/Gene_expression
https://www.yourgenome.org/facts/what-is-the-central-dogma
https://en.wikipedia.org/wiki/Central_dogma_of_molecular_biology
Figures:
Top right: Schematic of the general transfer of central dogma of molecular biochemistry. DNA is copied to DNA by the enzyme DNA polymerase (DNA replication). DNA is copied to RNA by the enzyme RNA polymerase (transcription). RNA is copied to protein by the ribosome (translation). https://en.wikipedia.org/wiki/Central_dogma_of_molecular_biology#/media/File:Central_Dogma_of_Molecular_Biochemistry_with_Enzymes.jpg
Bottom left: Cartoon depicting how a Pol II cluster (green) can increase the local amount of Pol II molecules, which copy the gene from DNA (black line) into mRNA transcripts (magenta). https://www.google.com/url?sa=t&rct=j&q=&esrc=s&source=web&cd=&ved=2ahUKEwj6os3d1un2AhUbjIkEHbnOBT0QFnoECAsQAQ&url=https%3A%2F%2Fphysics.mit.edu%2Fnews%2Fjournal%2Fphysicsatmit_20_cisse%2F&usg=AOvVaw1R__D0UV5HgJRyxhemuLzG
Slide 2: Fluorescence microscopy
Science details:
Fluorescence microscopy is a type of optical microscopy that uses fluorescence to generate images of organic or inorganic substances. Fluorescence occurs when a substance’s molecules, atoms, or nanostructures enter an excited state by absorbing electromagnetic radiation then emit light. The emitted light often has a longer wavelength (photon energy) than the absorbed radiation. Under a fluorescence microscope, a specimen is illuminated with light of a specific wavelength which the specimen absorbs via fluorophores (fluorescent chemicals that emit light after excitation). The fluorophores emit a (weaker) light of a longer wavelength which is distinguishable from the absorbed light.
Fluorescence microscopy is often used to image living cells because the typical choice of visible light used (a wavelength of 380-750 nm) is not damaging to the living organism. Light is a wave so the diffraction limit places an upper bound on the size of the features that can be imaged to ~half a wavelength, meaning the resolution limit is a few hundred nanometers. This means sub-diffraction resolution is needed to study the biomolecules (which are a few nanometers in scale) that make up the molecular machines in living cells. Photo-activated localization microscopy (PALM) and stochastic optical reconstruction microscopy (STORM) are two examples of “super-resolution” fluorescence microscopes that can image structures at the sub-wavelength scale.
Citations and resources:
https://en.wikipedia.org/wiki/Fluorescence_microscope
https://en.wikipedia.org/wiki/Fluorescence
Figures:
Left: Endothelial cells under a fluorescent microscope. The nuclei are stained blue (using DAPI), microtubules are stained green (using an antibody: Bodipy FL goat anti-mouse IgG), and F-Actin filaments are stained red (using Texas Red X-Phalloidin). https://en.wikipedia.org/wiki/File:FluorescentCells.jpg
Right:Jablonski diagram showing increasing energy on the y-axis for absorbance (blue arrow), non-radiative decay (red arrows), and fluorescence (green arrow). The ground and excited states are labeled by S₀ and S₁ respectively, which are further split into vibrational levels labeled from 0-3. https://www.wikiwand.com/en/Fluorescence
Slide 3: Diffraction-limited imaging
Science details:
The image of a point source seen by a microscope corresponds to the Airy disk of the imaging system. The Airy disk describes the best-focused spot of light seen by a perfect lens with a circular aperture within the limits of the diffraction of light. The Airy pattern describes the concentric rings around the Airy disk. The minimum resolvable distance d for light with a wavelength λ seen by a microscope with numerical aperture NA is given by the Abbe diffraction limit: d=λ/2NA. The center of the Airy disk is normally found by fitting the observed emission profile to a 2-dimensional Gaussian function. The error in the inferred position of the center is inversely proportional to the square root of the number of captured photons n. Therefore if many photons are collected then the error is small compared to the point spread function of the Airy disk.
Citations and resources:
https://abberior-instruments.com/knowledge/microscopy-tutorials/palm-storm/
https://en.wikipedia.org/wiki/Airy_disk
https://en.wikipedia.org/wiki/Diffraction-limited_system
Figures:
The field ɸ₀ of the Airy pattern is plotted against normalized radial coordinate R for a 2D intensity pattern shown in the top right inset. The field is at a maximum at the Airy disk which corresponds to the lobe N=0. Lobes 1,2, and 3 correspond to the first, second, and third bright rings. The field is zero at the first dark ring which lies at R₁=1, the following dark rings lie at R₂, R₃, and R₄. https://opg.optica.org/optica/fulltext.cfm?uri=optica-3-3-270&id=336952
Slide 4: PALM/STORM
Science details:
Photo-activated localization microscopy (PALM) and stochastic optical reconstruction microscopy (STORM) are “super-resolution” fluorescence microscopy techniques that can resolve images at a higher resolution than the diffraction limit.
To resolve two point sources due to two fluorophores using a microscope, they will need to be spaced apart by a minimum distance d given by d=λ/2NA, where λ is the wavelength of light and NA is the numerical aperture of the microscope. To overcome this diffraction limit, the two point sources need to be made distinguishable. PALM/STORM rely on the principle that all the molecules being observed begin in a (dark) off-state, then a small fraction of them are stochastically switched to the (fluorescent) on-state, then they are switched back to the off-state. This process is repeated, allowing different subsets of the molecules to enter the on and off states while taking many images of the molecules and localizing their positions to create super-resolution images.
The entire process of localizing many individual points and constructing the image takes time, which limits the observations to biological samples that are static (chemically frozen or dead). Cissé’s group developed “time-correlated photo-activation microscopy” (tcPALM) to overcome this limitation to observe dynamic, living biological samples.
Citations and resources:
https://en.wikipedia.org/wiki/Photoactivated_localization_microscopy
https://abberior-instruments.com/knowledge/microscopy-tutorials/palm-storm/
https://en.wikipedia.org/wiki/Airy_disk
https://en.wikipedia.org/wiki/Diffraction-limited_system
Figures:
Top: Animation of an assembly of molecules (black dots) that are too close to resolve using a conventional fluorescent microscope (seen as a single green spot of light). Individual molecules are stochastically switched on and off, each producing their own spot of light (yellow) and their positions are localized. https://abberior-instruments.com/knowledge/microscopy-tutorials/palm-storm/
Bottom: Conventional microscopy (far left) is unable to resolve the image from four fluorophores (yellow dots producing a blurred spot of red light). Localization microscopy involves stochastic activation and localization of individual molecules (middle) to reconstruct a high resolution image (far right). Adapted from http://huanglab.ucsf.edu/STORM.html and https://microbiologysociety.org/publication/past-issues/imaging/article/keep-palm-and-storm-on.html
Slide 5: Visualizing gene regulation with tcPALM (I)
Science details:
Cissé’s group developed “time-correlated photo-activation microscopy” (tcPALM) which analyzes the temporal information from the super-resolution imaging. This method lets them study dynamic biological samples. If the system was static, then the detections of photons would show temporal correlations that are statistically consistent with a stochastic process. A dynamic process would be revealed if the temporal correlations are distinguishable from those of a stochastic process.
They used tcPALM to study the Pol II enzyme which reads information from DNA and converts it to the RNA polymer, which is a transient message that the cell uses to make proteins. Each piece of information that Pol II copies is a gene, and it takes several minutes to copy one gene in a mammalian cell. They discovered that Pol II forms subdiffractive clusters that were not previously observed using conventional fluorescence microscopes. They used tcPALM to measure Pol II dynamics and made a surprising discovery: Pol II, which was previously believed to be “stable factories”, formed clusters of 100 molecules then disassembled after a few seconds - orders of magnitude shorter than the time it takes for Pol II to finish a transcript.
Cissé’s group used dual color super-resolution imaging to further study the function of Pol II clusters in living cells and made a new discovery of a mechanism for gene regulation. They used one color to perform tcPALM on Pol II and another color for the RNA transcripts produced by Pol II. They imaged Pol II clustering exactly at the locus of a gene during transcription and discovered that the Pol II clustering dynamics correlated linearly with the number of RNA copies produced. They found that one Pol II enzyme in a cluster engages on DNA every 2 seconds and that the total lifetime of the cluster determines how many RNA transcripts are made.
Citations and resources:
https://www.youtube.com/watch?v=Qn1i6A2C3E8
Figures:
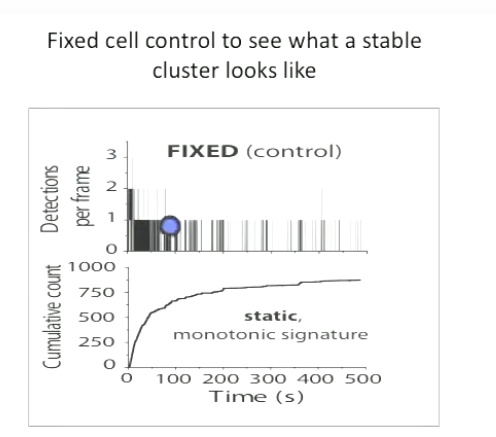
Top: Fixed cell control to see what a stable Pol II cluster looks like. Detections OF EMISSIONS?? per frame are plotted against time t (top) showing more detections close to t=0 and less as time passes. The cumulative counts are plotted against time t (bottom) showing a static, monotonic signature. https://www.youtube.com/watch?v=Qn1i6A2C3E8
Bottom left: Schematic of time-correlated detection counting from the nucleus of a live cell. Molecules are “photo-converted” and “bound” to a certain frame rate and detected then bleached to switch them to the off state (the legend marks pre-converted Pol II as a gray dot, converted Pol II as a yellow dot, converted and bound Pol II as an orange dot, and bleached Pol II as a black dot). There is a low frequency of detections when a single Pol II enzyme is converted and bound while interacting with DNA. There is a high frequency of detections while individual Pol II enzymes within a cluster interact with DNA. There is a low frequency of detections when Pol II does not interact with DNA. Local concentrations of Pol II are therefore shown by the relative changes in the frequency of detections. https://elifesciences.org/articles/13617
Bottom right: Conventional live cell fluorescence imaging (left) versus live cell super-resolution image (right). The super-resolution image is able to resolve many clusters of Pol II (green-hot color code). https://elifesciences.org/articles/13617
Slide 6: Visualizing gene regulation with tcPALM (II)
Science details:
Cissé’s group developed “time-correlated photo-activation microscopy” (tcPALM) which analyzes the temporal information from the super-resolution imaging. This method lets them study dynamic biological samples. If the system was static, then the detections of photons would show temporal correlations that are statistically consistent with a stochastic process. A dynamic process would be revealed if the temporal correlations are distinguishable from those of a stochastic process.
They used tcPALM to study the Pol II enzyme which reads information from DNA and converts it to the RNA polymer, which is a transient message that the cell uses to make proteins. Each piece of information that Pol II copies is a gene, and it takes several minutes to copy one gene in a mammalian cell. They discovered that Pol II forms subdiffractive clusters that were not previously observed using conventional fluorescence microscopes. They used tcPALM to measure Pol II dynamics and made a surprising discovery: Pol II, which was previously believed to be “stable factories”, formed clusters of 100 molecules then disassembled after a few seconds - orders of magnitude shorter than the time it takes for Pol II to finish a transcript.
Cissé’s group used dual color super-resolution imaging to further study the function of Pol II clusters in living cells and made a new discovery of a mechanism for gene regulation. They used one color to perform tcPALM on Pol II and another color for the RNA transcripts produced by Pol II. They imaged Pol II clustering exactly at the locus of a gene during transcription and discovered that the Pol II clustering dynamics correlated linearly with the number of RNA copies produced. They found that one Pol II enzyme in a cluster engages on DNA every 2 seconds and that the total lifetime of the cluster determines how many RNA transcripts are made.
Citations and resources:
https://www.youtube.com/watch?v=Qn1i6A2C3E8
Figures:
Bottom left: Live cell dual-color super-resolution image of nascent RNA molecules (magenta) and Pol II (green). The yellow arrow points to where Pol II transcribes DNA into RNA molecules (“colocalization” of Pol II and RNA molecules at a gene locus), which is shown in white. https://www.google.com/url?sa=t&rct=j&q=&esrc=s&source=web&cd=&ved=2ahUKEwj6os3d1un2AhUbjIkEHbnOBT0QFnoECAsQAQ&url=https%3A%2F%2Fphysics.mit.edu%2Fnews%2Fjournal%2Fphysicsatmit_20_cisse%2F&usg=AOvVaw1R__D0UV5HgJRyxhemuLzG
Top right: Detections of a Pol II cluster per frame and cumulative detections per frame are plotted against time. The black arrow points to the onset of Pol II clustering, the blue arrows point to the apparent Pol II cluster lifetime. https://elifesciences.org/articles/13617
Middle right: Histogram of the apparent Pol II cluster lifetime (τ_cluster) for data from 214 clusters from 6 live cells. The average cluster lifetime is 8.3 (± 0.2) seconds. https://elifesciences.org/articles/13617
Bottom right: Number of mRNA transcripts is plotted against Pol II cluster lifetimes with error bars. The linear correlation shows that if the Pol II cluster stays at the gene locus for longer, more mRNA transcripts are produced, despite the transient lifetime of the cluster. https://www.google.com/url?sa=t&rct=j&q=&esrc=s&source=web&cd=&ved=2ahUKEwj6os3d1un2AhUbjIkEHbnOBT0QFnoECAsQAQ&url=https%3A%2F%2Fphysics.mit.edu%2Fnews%2Fjournal%2Fphysicsatmit_20_cisse%2F&usg=AOvVaw1R__D0UV5HgJRyxhemuLzG
Initial notes
Cissé page: https://physics.mit.edu/faculty/ibrahim-cisse/
- They want to quantify “weak and transient” interactions = “the organization and dynamics within [the cell] are often regulated through complex rules involving low affinity, highly dynamic biomolecular interactions”.
- They’re interested in the “collective behaviors that emerge from weak and transient biological interactions in living cells”.
- In humans: “we understand very little of how transcription, the first step in the central dogma of biology – that DNA makes RNA (and RNA makes Proteins) – is carried out at the cellular level”. “Complex behaviors involving transient spatiotemporal clustering of molecular enzymes control genome regulation in ways that only now are we able to visualize.”
- “Our approach is to develop and use highly sensitive experimental techniques capable of detecting and quantifying in a meaningful manner weak and transient biomolecular interactions. We have developed biophysical tools to measure weak and transient interactions both among isolated biomolecules (in vitro), and directly inside individual living cells with single-molecule sensitivity. Currently, we set out to understand what roles weak and transient interactions play in regulating genomic processes and nuclear organization at the single-cell level.”
Research group page at MIT: http://www.icisse.org/
- We “leverage expertise in Single Molecule and Super-Resolution imaging in live cells to study collective behaviors (e.g. protein clustering) emerging from weak or transient biomolecular interactions in mammalian cells.”
- “We unveil, often for the first time, that these clusters exist in living cells, and we expand both on the imaging approaches and the cellular and molecular biology techniques to discover the biophysical mechanisms of action, and their function in vivo .”
I found a talk! 2020 Lecture: https://www.youtube.com/watch?v=Qn1i6A2C3E8
- Intro: central dogma of biology (DNA, RNA).
- A lot is known about Pol II: the cartoon is simplistic, maybe even wrong. We can’t actually see this. The reality can be revealed (?) with single molecule imaging (?). Use a fluorescence microscope.
- Stokes: “dispersive reflection” is a bad term. Want fluorescence microscopy: look at light emitted from a single molecule - big blob 100 times bigger than size of molecule - so need 100 times size difference… diffraction stuff. Airy disk pattern from destructive/constructive interference, central lobes (optics stuff?). So you can localize centers with accuracy: this is principle behind single molecule super resolution techniques (eg. PALM and STORM).
- How does it work? (Cute example to resolve where people are by ear - stochasticity by dividing by birthdays). With super-resolution: most are off, only a few random ones turn on at same time - they’re localized, record. Never got whole picture in a single frame. In enough time you get enough localization to reconstruct localization.
- Limitations: obvi things like PALM and STORM work well for static/fixed things (structures). And has to be below diffraction limit (?)
- His systems are highly dynamic. One approach: time-correlated super-resolution (tcPALM).
- Can see if static or dynamic: is cluster always there in temporal history (obeys same statistics as stochastic process???)
- Frozen cell = no dynamics.
- = signature for stable cluster. CDF goes up with each detection but plateaus.
- = not fixed. No detection for first half, then spike.
- Biological processes take longer, so this “seems” not interesting to biologists. So active = so transient.
- Can block a process (with DRB) then it looks like the static thing again.
- Now do duo-color microscopy, label one gene (where RNA is made). Pol II clusters dynamics correlate directly with mRNA output.
- Clusters
- See lots of RNA, source of pump where most are being made at extra-bright locus (tiny dot) b/c few RNAs are bound and being made - then focus at that gene locus, get super resolution with a bright color. Pol II is in a different color. See if they intersect??
- Cluster lifetimes go up then down, this was known but the peak wasn’t known??? Happened around 2.5 minutes - consistent with how long process takes… I don’t understand what was/was not known.
- Conclusion: get linear relationship between Pol II cluster lifetime and number of mRNA. This was neat because mRNA wasn’t correlated with the dynamics but rather the cluster lifetime.
- (more after ~ 40 minutes, but that might be too much for these slides)


Slides rough outline (~6 slides?)
- Intro slides:
- Central dogma of biology, Pol II.
- Fluorescence microscopy concepts.
- PALM/STORM principles: super-resolution (beyond diffraction limit), snapshots of local stuff, takes time (some bio processes exceed these timelines), reconstruct stuff. Good for statics, bad for dynamics. (Could include the shouting example?)
- tcPALM experiment:
- tcPALM: how is it different from PALM?
- Setup - interrupted a process to extend time to take results?
- Results show linear correlation between Pol II cluster lifetimes and the number of mRNA.